Scrum is a conversation framework. Kanban is a framework for asking the right questions sooner rather than later. Combining the two sets the stage for a Scrum team to reach new heights of Throughput in value delivery.
The idea of visualizing your work is common among Scrum teams. Often there is a "To Do, Doing, Testing/Review, Done" board where cards are dragged through the system to communicate where work items are in the workflow during the current Sprint and is a way for anyone in the organization to view "how things are going".
While this practice is an excellent start to a solid workflow, allow me to pose the following scenario:
"When will it be done?"
A stakeholder approaches you and asks when your product will have specific functionality. Of course, this is the ever-asked "When will it be done?" question.
As Daniel Vacanti has pointed out in this presentation, the question "When will it be done?" requires an answer framed in elapsed time. Yet, the metric you are likely tracking is the Velocity of relative complexity (or story points) completed Sprint over Sprint.
"Relative what?"

How does one answer "When will it be done?" in story points? Does the stakeholder understand story points? Do they care? If a question requires elapsed time to answer, wouldn't elapsed time need to be the tracking metric and not some weird conversion of relative complexity finished Sprint over Sprint?
Instead of tracking relative complexity, what would happen if we tracked the flow of work through your system? These "flow metrics" are far more capable of offering answers framed in elapsed time.
Flow is the primary goal of Kanban. The great news is that your Scrum board already has some of the main ingredients needed to make the paradigm shift to incorporating Professional Kanban and to tracking flow metrics in your Scrum practices. First, let's start by defining what Kanban even is.
"What is Kanban?"
Kanban is a strategy to achieve flow by:
Defining and visualizing a workflow
Actively managing items in a workflow
Improving that workflow
That seems relatively straightforward, right? Especially since you are likely doing some of this already with your Scrum board.
Defining and Visualizing a Workflow

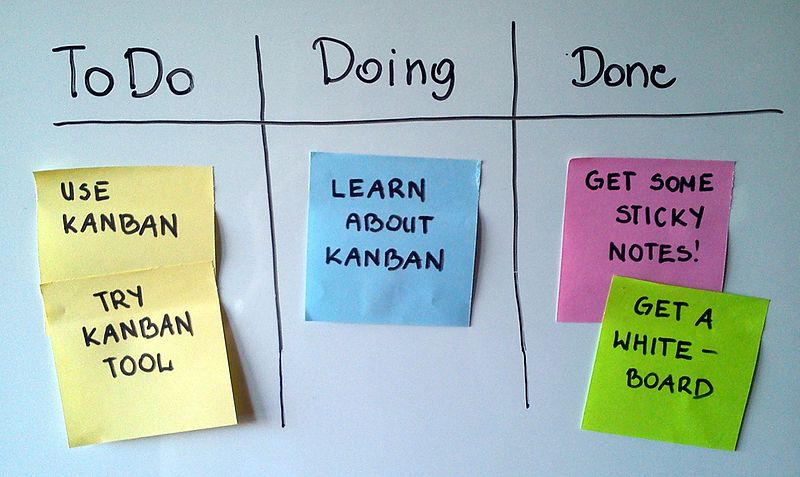
"Simple personal Kanban board" by kanban_tool is licensed under CC BY-SA 2.0
If your Scrum team already has "To Do, Doing, Testing/Review, Done", you are already using something to visualize how your work items are progressing through a workflow you've defined. It doesn't matter how complex or straightforward your definition is. If your team has agreed on those columns (or at least hasn't disputed them, although agreeing to them carries more ownership), that's your team's definition of workflow, and your Scrum board visualizes it.
Can we get more complex? Sure. We could talk about swim lanes and pull policies ad nauseam, but for the sake of just starting, let's keep it as simple as your current Scrum to-do board.
Actively Managing Items in a Workflow
Ok, so keeping with simplicity, if you've ever dragged a card from "To Do" to "Doing", I would argue you already have some experience with actively managing work items. Can we get more complex? Again, sure. One of the things we will talk about later is Work In Progress Limits, which is another facet of actively managing work items. Still, if you are making the conscious decision to move that item through your workflow because you have the capacity to start working on it, you're off to a good start.
Improve the Workflow
Ahhhh... now this is where Professional Kanban reveals its "next levelness" over just having a to-do board. The intricacies of improving the workflow reveal the metrics of flow to those who are observing, so let's talk about those metrics now.
The Metrics of Kanban
There are four metrics one tracks in Professional Kanban.
Work in Progress (WIP)
Work Item Age
Cycle Time
Throughput
Let's talk about each.
Work In Progress
Work in progress is pretty simple. It's a metric that measures how many work items are in a specific portion of your workflow at any given time. So, for example, if you walk up to a Scrum board (or pull up a Trello board) and you see there are four cards in the "Doing" column, then the "Doing" portion of your workflow has a Work In Progress (WIP) count of 4. Mind blown, right? So why do we care?
WIP limits.
Part of improving that workflow has to do with limiting the amount of work in progress. So, for example, if your "Doing" column has a WIP limit of 4, then the example above is already at its limit, and you purposely don't start a 5th item. Why? Because WIP affects Cycle Time.
Work Item Age and Cycle Time

The moment you moved a work item from the "To Do" column to the "Doing" column, it became a Work In Progress, and the metric Work Item Age started ticking. Work Item Age tracks how long a work item is between the boundaries of your process (how long it's in progress). Meaning, when you drag that sucker to "Done", not only do you feel good, but it just passed the other boundary of your process and is no longer a Work In Progress... it's done. At that moment, Work Item Age stops ticking.
The amount of elapsed time (whoa, who knew that was going to come up again) a WIP spent inside the boundaries of "Doing" and "Done" is your Cycle Time. I mentioned earlier that WIP affects Cycle Time.
Imagine you're on a Scrum team of 10 or less, and you have 1000 items in your "Doing" column. Work Item Age is just ticking away on at least 990 of those items. How old will those items get before everyone clears them out all the way to "Done"? Many of those items are going to have massive Cycle Times. There is something called Little's Law, which is outside the scope of this article, that shows a direct relationship between WIP, Cycle Time, and Throughput.
Throughput
While Cycle Time measures how long it takes a single item to move through your workflow, Throughput is all about multiple items. Thus, Throughput measures how fast multiple items are getting to "Done" whether you measure it in days, weeks, or whatever unit of time you decide.
Because it requires a unit of elapsed time (there it is again), it is not the same as Velocity, which uses a Sprint to calculate. That is very different, and I recommend making it a habit to differentiate Velocity from Throughput, as a Sprint isn't a unit of elapsed time.
Throughput this week vs. last week (an elapsed time) is different from this Sprint vs. last Sprint (which could be a month or less).
So What?
Ok, that's a fundamental primer of Kanban and its metrics. You only need three metrics to answer a question that requires an answer framed in elapsed time. WIP, Cycle Time, and Throughput. Let's talk about how we get there.
Scatterplots

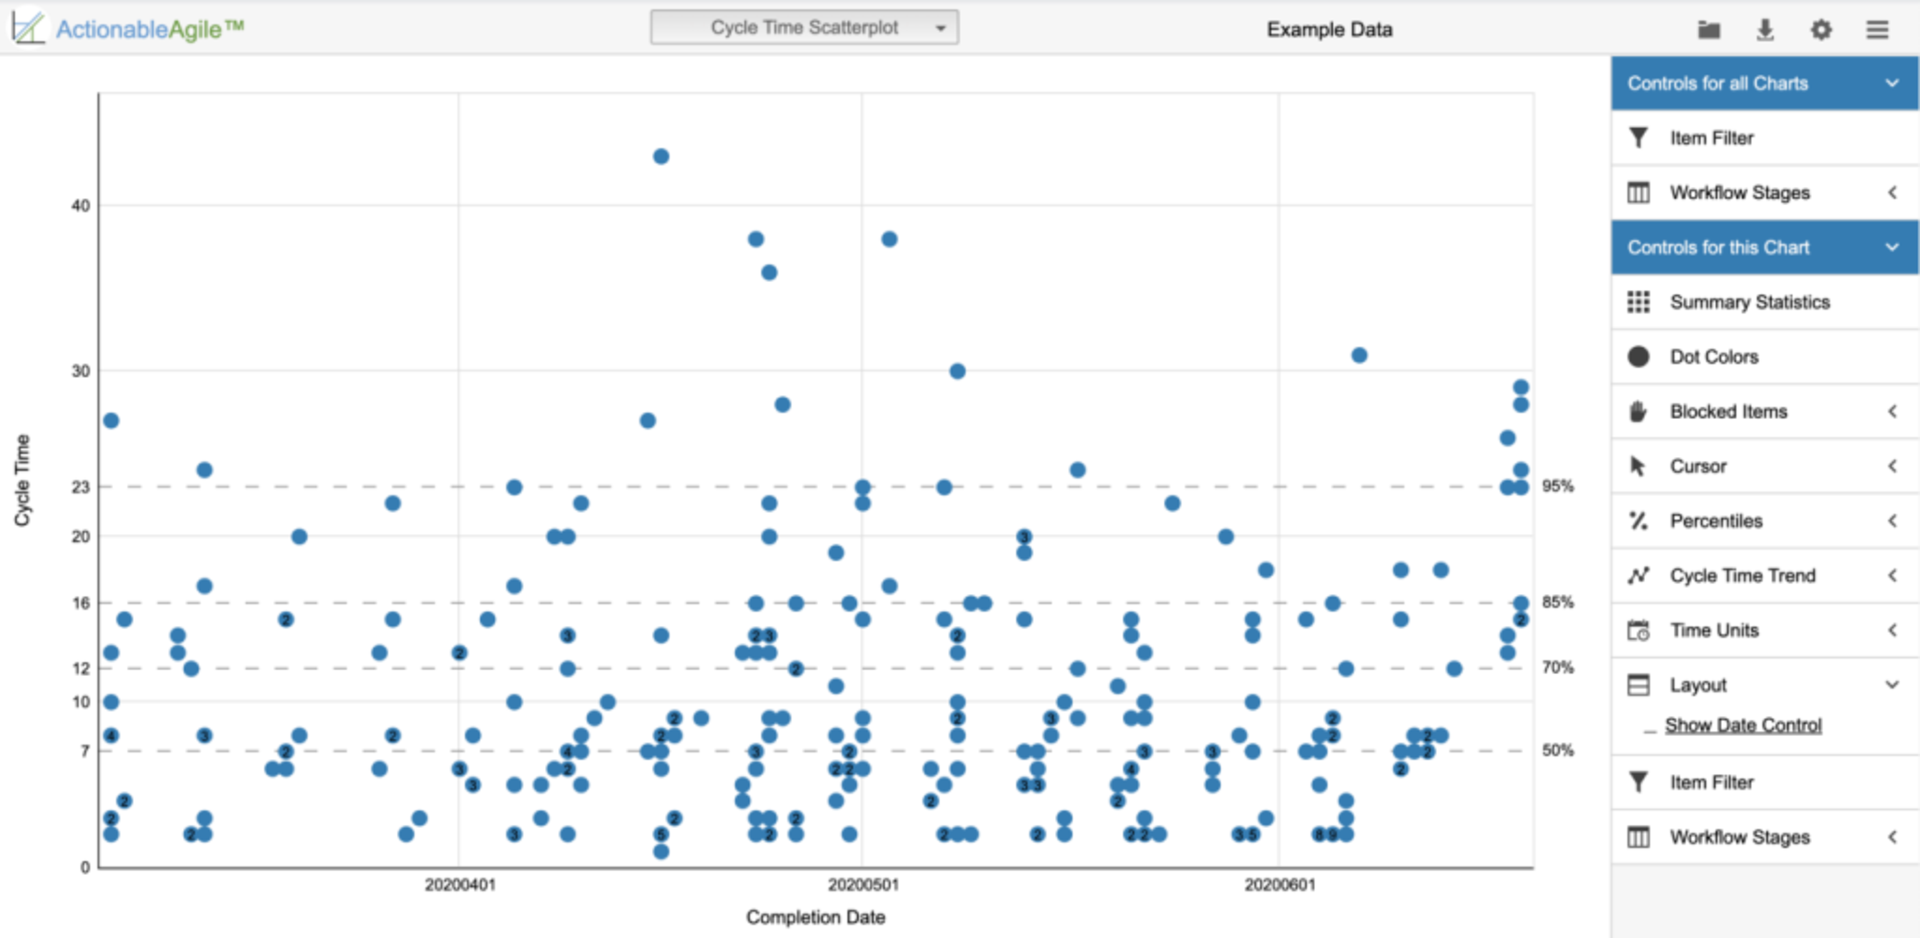
Image from ActionableAgile.com (click to enlarge)
Scatterwhat? It sounds like a band name, right?.
What it actually is are points on a graph that only get added when a work item completes and exits the system ("Done"). Along the bottom (X-axis) is the date, and along the left side (Y-axis) is the number of days that work item took, or as we know it now, its Cycle Time. Why do we care?
Looking at the Cycle Time scatterplot (click to enlarge), you see that line that says 50%? That line shows us that 50% of our work items are finished in 7 days, and 50% of them take longer. Hmmm... are you intrigued yet?
Let's lift our eyes and look at that 85% line. That shows us that 85% of our work items have a Cycle Time of 16 days or less, while only 15% of our items ever age past 16 days. If this is tickling that part of your brain that says, "Hey, using this means we would have actual data about how long it takes us to do stuff!", I'm so glad you got there.
Enter Monte Carlo Simulations
No, this isn't a giant game where you climb into a 1988 Monte Carlo SS replica and drive around town in HD and glorious Dolby Surround (someone get on that). But it is where we can answer two sides of the "When will it be done?" coin.
If we have been tracking the three metrics of flow (WIP, Cycle Time, and Throughput), a Monte Carlo Simulation can tell us two things. "How many days will it take given this many work items?" and "How many work items can we get done in X days?".

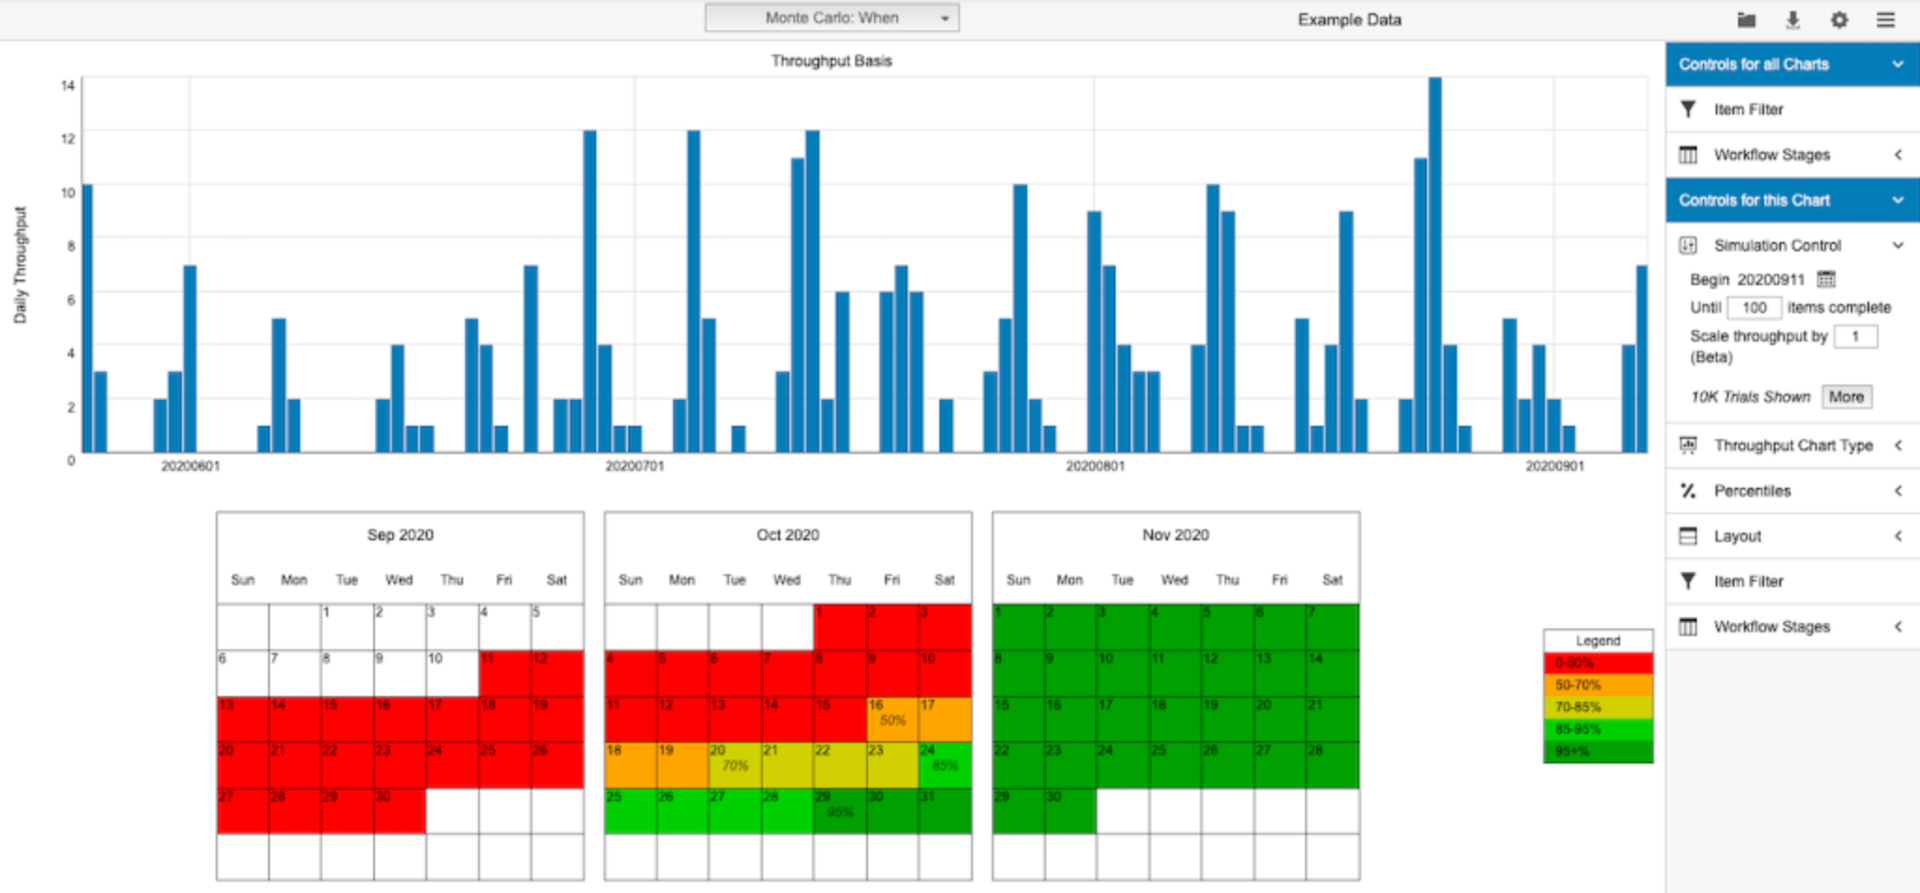
Image from ActionableAgile.com (click to enlarge)
How to run these simulations is beyond the scope of this article, but know that when someone approaches you with "When will it be done?", looking at the Monte Carlo Simulation (click to enlarge) you'll have answers like "We have an 85% probability that we can get all of those work items done by October 24th." What a difference tracking flow metrics makes.
Further Reading
So, of course, there is always more to learn. I didn't even get into what a Cumulative Flow Diagram is. Or how Kanban is a pull system, not a push system. No mention of what a Service Level Expectation is, what segmenting WIP limits means, why stability in your system matters, or how to achieve it. However, I'm confident that if you weren't familiar with flow metrics before reading this article, this has sparked some thought about the advantages of flow metrics vs. story point Velocity, and for me, that's a win.
Scrum.org has a great page with more resources about Professional Scrum with Kanban (PSK), where you can find the official Kanban Guide for Scrum Teams. Also, there are excellent resources over at ProKanban.org, like the official Kanban Guide.
Let me know in the comments if your team is using Professional Kanban in your Scrum practices and how it’s helped them as I would love to hear about you and your experience.
